

Collect and represent numerical data, including fractional values, using tables, stem-and-leaf plots or line plots.
Determine the mode, median or range to interpret numerical data including fractional values, represented with tables, stem-and-leaf plots or line plots.
Solve real-world problems involving numerical data.


The median is the number in the center of the data set. It is found by listing the numbers in order, from least to greatest, and then finding the number that is in the center of the data set.
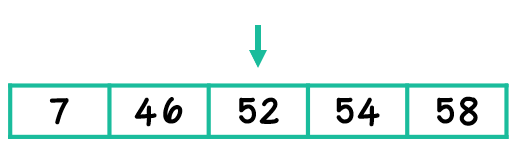
When there is an odd number of terms in the data set, the median is simply the center, or middle number, when the numbers are placed in numerical order from least to greatest. In this example, the median is 52.

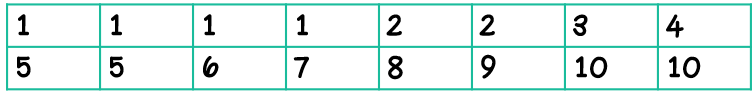
Mode is the most common or most frequent data point in a set. It is useful for discrete data, or when you are dealing with a count or a vote. In this data set, the mode is 1. There are four 1s in the data set.
Advantages
Disadvantages

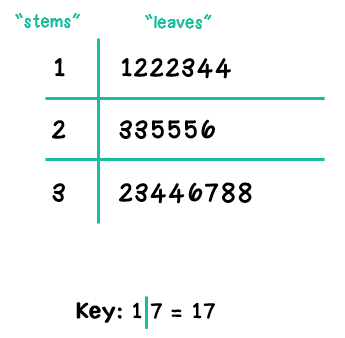
A stem-and-leaf plot is a way to display data.
In this stem-and-leaf plot, the "stems" are the tens digits, and the "leaves" are the ones digits.

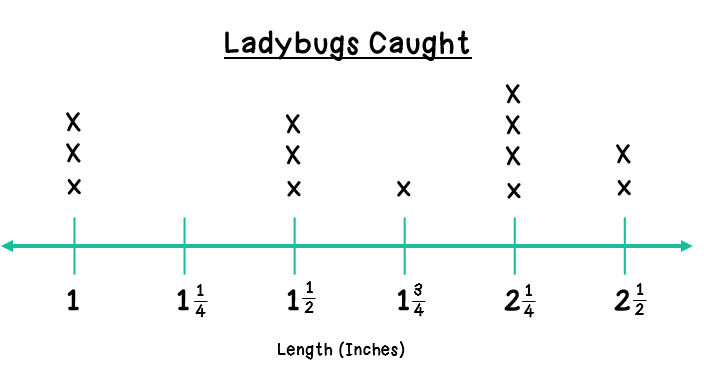
Line plots display data frequency. They are closely related to fractions and number lines. Students need to be able to read and produce a line plot that uses fractional values.