
Develop an understanding of statistics and determine measures of center and measures of variability. Summarize statistical distributions graphically and numerically.
Recognize and formulate a statistical question that would generate numerical data.
Given a numerical data set within a real-world context, find and interpret mean, median, mode and range.
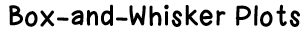
Given a box plot within a real-world context, determine the minimum, the lower quartile, the median, the upper quartile and the maximum. Use this summary of the data to describe the spread and distribution of the data.
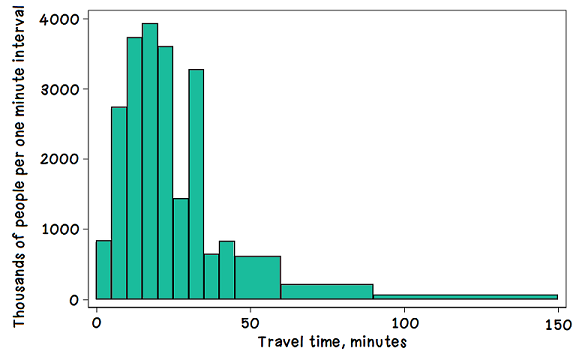
Given a histogram or line plot within a real-world context, qualitatively describe and interpret the spread and distribution of the data, including any symmetry, skewness, gaps, clusters, outliers and the range.
Create box plots and histograms to represent sets of numerical data within real-world contexts.
Given a real-world scenario, determine and describe how changes in data values impact measures of center and variation.


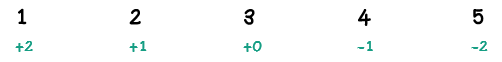
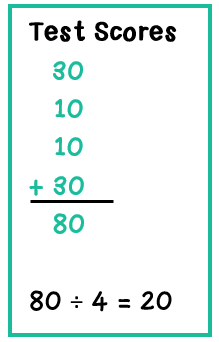
In this data set, you could redistribute the numbers so that they all were equal to 3. That's the mean of the data set!
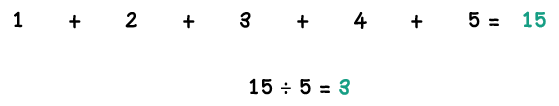
In order to find the mean, add up all 5 numbers in the set, then divide by 5.

Mean absolute deviation is the average distance from the mean of all the terms in the data set
Find the mean absolute deviation by:
- Calculating mean of data set
- Finding difference between each term and the mean
- Averaging all the differences together
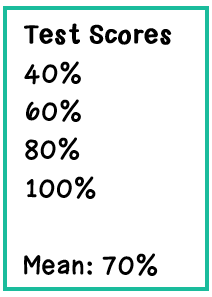
The mean (70%) is already calculated. Now, we will look at the difference between each test score and the mean. We find this difference by simly subtracting the two numbers. When finding "mean absolute deviation," the word "absolute" refers to "absolute value." Find the absolute value of the difference; do not consider positive vs. negative numbers when finding this difference.
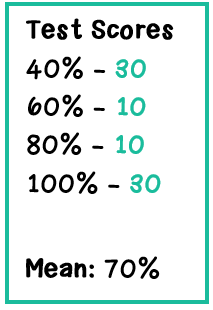
The differences are all listed in teal. The next step is to find the mean of these differences. Simply add the numbers, and divide by 4, since there are 4 test score differences.
A higher mean absolute deviation indicates that the numbers in the data set are spread out more, or have a greater variability. A lower mean absolute deviation indicates that the numbers in the data set are less spread out, or have less variability.

The median is the number in the center of the data set. It is found by listing the numbers in order, from least to greatest, and then finding the number that is in the center of the data set.
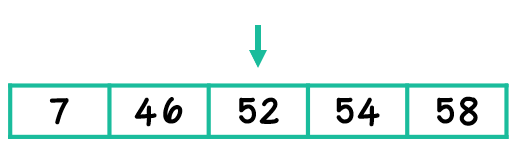
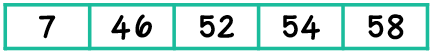
When there is an odd number of terms in the data set, the median is simply the center, or middle number, when the numbers are placed in numerical order from least to greatest. In this example, the median is 52.
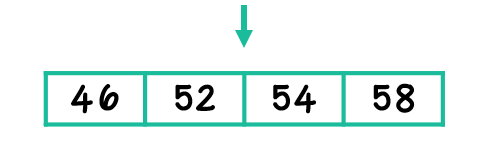
When there is an even number of terms in the data set, the median is the mean of the two center terms. In this example, the mean of 52 and 54 is 53.

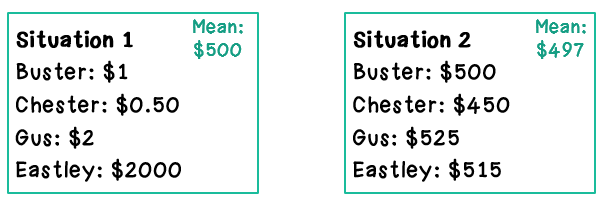
In Situation 1, Eastley’s amount of money is bringing the mean (average) up to $500, even though most people in the group have $2 or less. Eastley's large amount of money, compared to the rest of the group, is an outlier. It's much different than the rest of the numbers in the data set. In Situation 2, the mean (average) is similar at $497. However, this number is more representative of the numbers in the data set, since most people in the second group do have around $497.
Mean with the outlier: 43.4
Mean without the outlier: 52.5
Median with the outlier: 52
Median without the outlier: 53

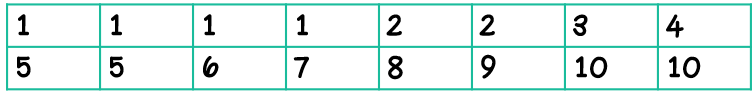
Mode is the most common or most frequent data point in a set. It is useful for discrete data, or when you are dealing with a count or a vote. In this data set, the mode is 1.
Advantages
Disadvantages
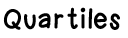
The median (Q2) divides the data set into 2 halves. The Q1 is the median of the lower half, and Q3 is the median of the upper half.
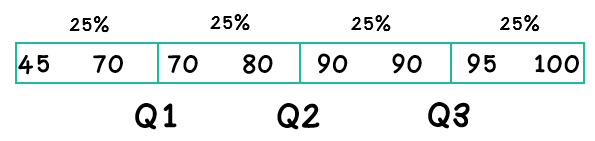
Q1, Q2, and Q3 can be thought of as “cuts” that divide the data into 4 equal sections, with each section containing 25% of the data.
A histogram is a type of graph that shows the frequency of data points. In a histogram, the bars touch, and the data is organized into intervals.